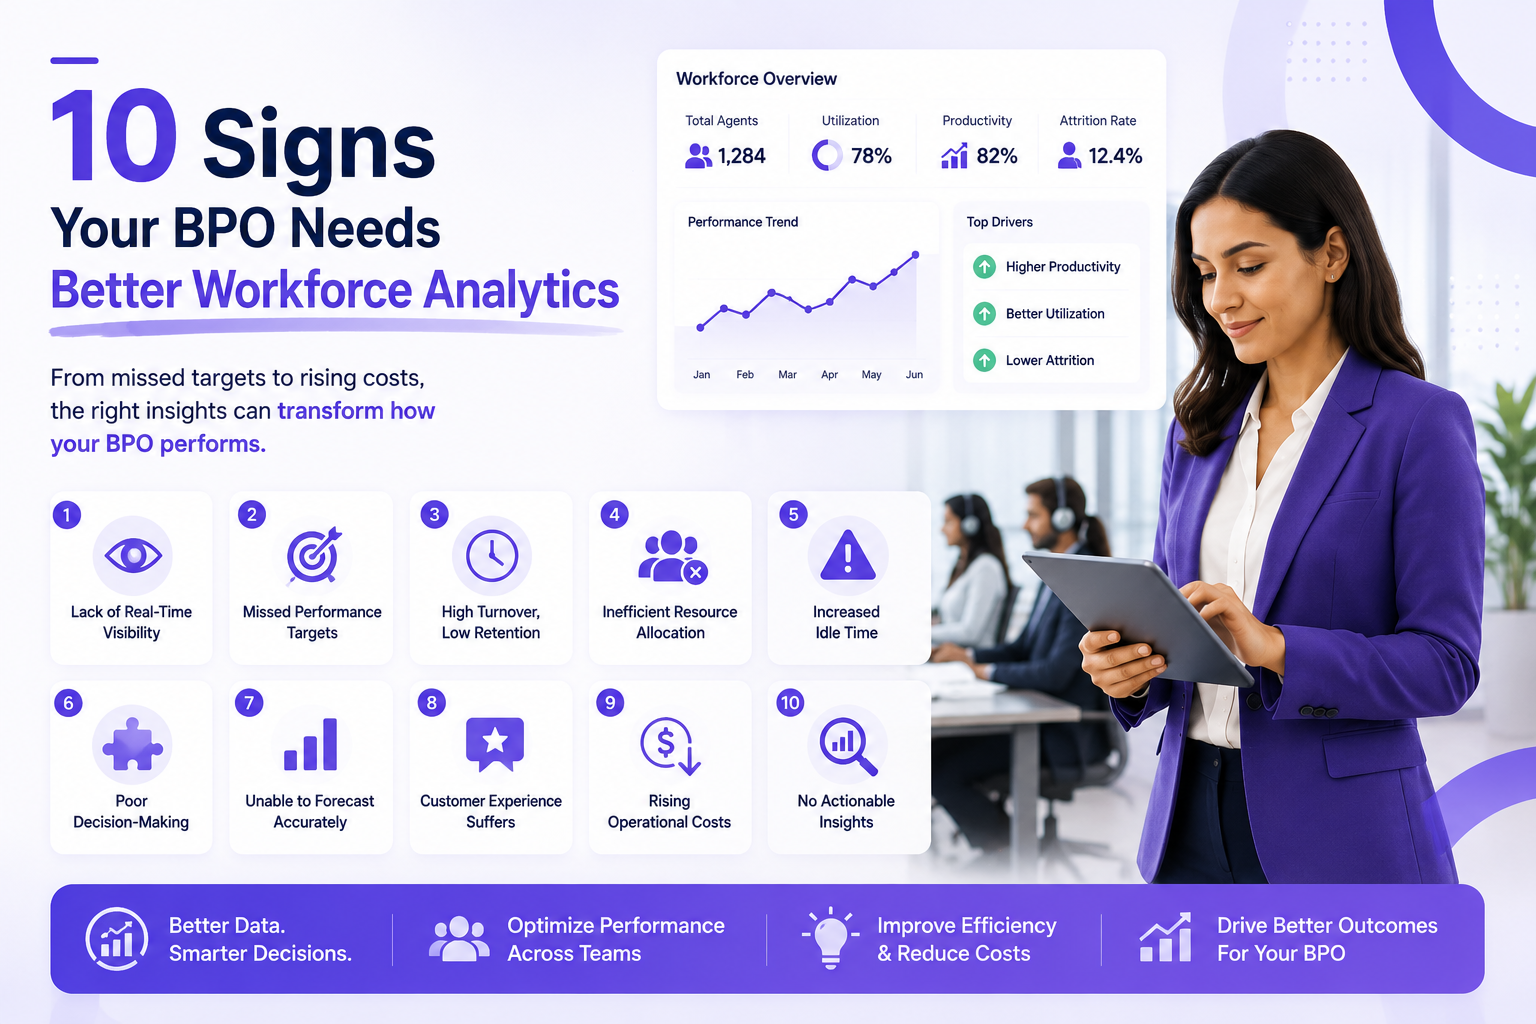

If you're running a BPO or contact center, the warning signs of weak workforce visibility rarely show up as one big failure. They show up as a slow accumulation of small ones — a missed SLA here, an unexplained attrition spike there, a client asking a question about utilization that nobody can answer with real data. Workforce analytics for BPO operations means using activity, attendance, and performance data to see exactly how agent time is spent, rather than relying on supervisor instinct or lagging monthly reports.
The BPO industry runs on thin margins and tight SLAs, which means it can least afford to fly blind on workforce data. Below are 10 concrete signs that your current setup — spreadsheets, gut feel, or a monitoring tool that only tracks logins — isn't giving you what you actually need.
1. Your Attrition Rate Is Above Industry Benchmark — and You Don't Know Why
Annual attrition in the BPO industry typically runs between 30% and 45%, with voice-based processes often running higher than non-voice. If your attrition sits above that range and you can't point to a root cause — is it a specific shift, a specific team lead, a specific client process — that's a visibility gap, not a hiring problem. Modern workforce analytics should be able to correlate attrition against schedule adherence, workload distribution, and manager span of control, so you're fixing the actual cause instead of just backfilling seats.
2. You Only Find Out About SLA Misses After the Client Does
If your first signal that occupancy dropped or handle times spiked is a client escalation email, your reporting is lagging, not real-time. Occupancy sustained above 90% is a widely cited burnout red flag, while occupancy below 70% usually signals overstaffing or scheduling slack. Either extreme should trigger an internal alert well before a client notices it in their monthly business review.
3. Schedule Adherence Looks Fine on Paper but Feels Wrong on the Floor
Top-performing BPO operations maintain schedule adherence above 95%. But adherence calculated purely from login/logout timestamps can hide a lot — an agent can be "logged in" and still be idle, on an unauthorized break, or toggling between unrelated tasks. If your adherence number looks healthy but supervisors still sense the floor is understaffed during peak hours, you're measuring presence, not actual availability.
4. You're Managing Multiple Clients on One Spreadsheet
Multi-client BPO floors need utilization and productivity broken out per client, per process, and per shift — not blended into one org-wide average. If your reporting can't answer "how is Team A performing on Client X's process versus Client Y's process" without a manual export and pivot table, your analytics setup isn't built for how outsourcing actually runs.
5. New Agents Take Too Long to Ramp — and You Can't Tell Where They're Getting Stuck
First-year attrition is disproportionately high across the BPO industry, and much of it traces back to a rough ramp period. Without granular activity data, you can't see whether new hires are struggling with a specific application, spending too long in after-call work, or simply not getting enough live call time in their first two weeks. Good workforce analytics turns ramp-up from a guess into a measurable, coachable process.
6. Overtime and Burnout Numbers Keep Climbing Without an Obvious Cause
87% of contact center agents report high levels of workplace stress, and burnout is one of the most underdiagnosed drivers of BPO attrition. If overtime hours are creeping up and you can't tell whether it's driven by understaffing, inefficient processes, or a handful of overloaded team leads, you're missing the early warning signs that precede a resignation wave, not just a bad month.
7. Your Reports Are Monthly, but Your Problems Are Daily
A monthly business review that shows a dip in productivity is a month too late to act on it. Real-time or daily dashboards let team leads intervene the same shift a metric goes off track — reassigning workload, coaching an agent, or flagging a process bottleneck — instead of explaining a bad month to a client after the fact.
8. You Can't Prove Compliance When a Client or Auditor Asks
BPO floors handling regulated processes (financial services, healthcare, insurance) need audit-ready records of who accessed what, when, and for how long. If pulling that data for a client audit takes days of manual digging through separate systems, that's a compliance risk sitting on top of a visibility problem.
9. Good Performers Are Leaving Faster Than Weak Ones
If your best agents are the ones resigning first, it's usually a sign that workload isn't being distributed fairly — high performers get handed more volume as a reward, burn out faster, and leave. Without utilization data broken down per agent, this pattern is invisible until it shows up as a retention crisis among your most experienced people.
10. You're Making Staffing Decisions on Gut Feel, Not Trend Data
Deciding to add or cut headcount based on "it feels busy" or "it feels quiet" instead of actual utilization and volume trends is one of the most expensive mistakes a BPO can make — both overstaffing (margin erosion) and understaffing (SLA risk, burnout) are costly in a thin-margin business. Workforce analytics should give you enough trend visibility to staff proactively for the next quarter, not reactively for the quarter that already went wrong.
What Better Workforce Analytics Actually Looks Like for a BPO
The common thread across all 10 signs is the same: activity-level, real-time, per-client, per-shift visibility — not blended averages, not monthly snapshots, not login-based adherence numbers that miss what's actually happening on the floor. For India-based operations specifically, the benchmarks worth measuring against are agent utilization around 75-85% of paid time, occupancy in the 85-90% range, and schedule adherence above 95%, with attrition and engagement tracked as leading indicators, not just end-of-quarter reporting.
If more than two or three of these 10 signs sound familiar, the fix usually isn't hiring more supervisors or asking agents to self-report more — it's putting a proper workforce analytics layer under the operation so the data surfaces these problems before they become client escalations or resignation spikes.
Frequently Asked Questions
What is workforce analytics in a BPO? Workforce analytics in a BPO is the use of real-time activity, attendance, and performance data to measure agent utilization, occupancy, schedule adherence, and productivity — giving managers visibility into how work actually gets done across shifts and clients, rather than relying on end-of-month reports.
What is a good attrition rate for a BPO? Industry-wide, BPO attrition typically runs between 30% and 45% annually, with voice-based processes often on the higher end. Operations with attrition consistently above that range are usually dealing with root causes like burnout, poor ramp-up support, or uneven workload distribution that better analytics can help identify.
What KPIs should a BPO track for workforce management? Core KPIs include agent utilization (target roughly 75-85% of paid time on productive work), occupancy (85-90% is the commonly cited healthy range), schedule adherence (95%+ in top-performing centers), attrition rate, and average handle time, tracked per client and per shift rather than as a single blended average.
How does workforce analytics help reduce BPO attrition? It helps by surfacing the leading indicators of attrition before agents resign — rising overtime, uneven workload distribution, slow ramp-up progress for new hires, and burnout signals like sustained high occupancy — so managers can intervene during the shift or week it happens, instead of discovering the problem in a resignation report.
What's the difference between occupancy and utilization in a call center? Utilization measures the percentage of an agent's paid time spent on productive work. Occupancy measures the percentage of logged-in time spent actively handling contacts versus waiting between them. Sustained occupancy above 90% is generally considered a burnout risk, even when utilization looks healthy.