
Most call centers track too many metrics and act on too few. Dashboards fill up with numbers, but only a handful of them actually predict whether a shift will hit its targets, whether a customer will churn, or whether an agent is about to quit. With average contact center turnover sitting around 30% annually — and monthly attrition swinging between 2.3% and 6.1% depending on the site and season — the cost of tracking the wrong things isn’t just inefficiency, it’s compounding staffing losses that are expensive to replace.
Here are the seven KPIs worth building your operation around, and what each one is actually telling you.
1. Service Level
Service level is the percentage of calls answered within a specified time window — commonly “80% of calls answered within 20 seconds,” though the exact target varies by industry. It’s the metric most centers report to leadership because it’s the most direct proxy for whether staffing matches demand in real time.
Why it matters beyond the surface number: a service level that’s consistently missed isn’t usually an agent problem — it’s a forecasting and scheduling problem. Chronic misses point to under-resourced shifts, which in turn drive the stress and schedule instability that studies link to elevated turnover intent.
How to act on it: Segment service level by hour and day of week, not just as a daily average. A center that hits 80% overall but collapses every Monday morning has a scheduling gap hiding inside a healthy-looking average.
2. Average Handle Time (AHT)
AHT measures the duration of a call from the moment an agent answers to disconnection, including any related wrap-up. It’s one of the oldest call center metrics and still one of the most misused — many centers treat “lower AHT” as an unconditional good, which pushes agents to rush calls and quietly damages first-call resolution and customer satisfaction.
How to act on it: Track AHT alongside first call resolution, never alone. Rising AHT with rising resolution is often healthy — agents are solving more in one call. Falling AHT with falling resolution is a red flag, not a win.
3. First Call Resolution (FCR)
FCR tracks the percentage of interactions fully resolved without a transfer, escalation, or repeat contact. Industry analysts frequently call it “the single most important KPI related to a customer’s level of satisfaction” — and it’s also a strong efficiency signal, since every unresolved call becomes a second (or third) call that consumes more agent time overall.
How to act on it: Break FCR down by issue type and by agent tenure. A center-wide FCR of 75% can hide a new-hire cohort resolving at 50% — exactly the population most likely to need targeted coaching or better real-time support tools.
4. Occupancy Rate
Occupancy measures the percentage of an agent’s logged-in time spent actively on calls or associated work, as opposed to idle between contacts. It’s a useful efficiency metric, but it has a ceiling: pushing occupancy too high (often cited above 85–90%) removes the breathing room agents need between difficult calls, which accelerates fatigue and error rates.
How to act on it: Treat occupancy as a band to manage within, not a number to maximize. If occupancy keeps climbing while quality scores or AHT-per-issue-type worsen, you’re trading long-term retention for short-term utilization.
5. Agent Absenteeism
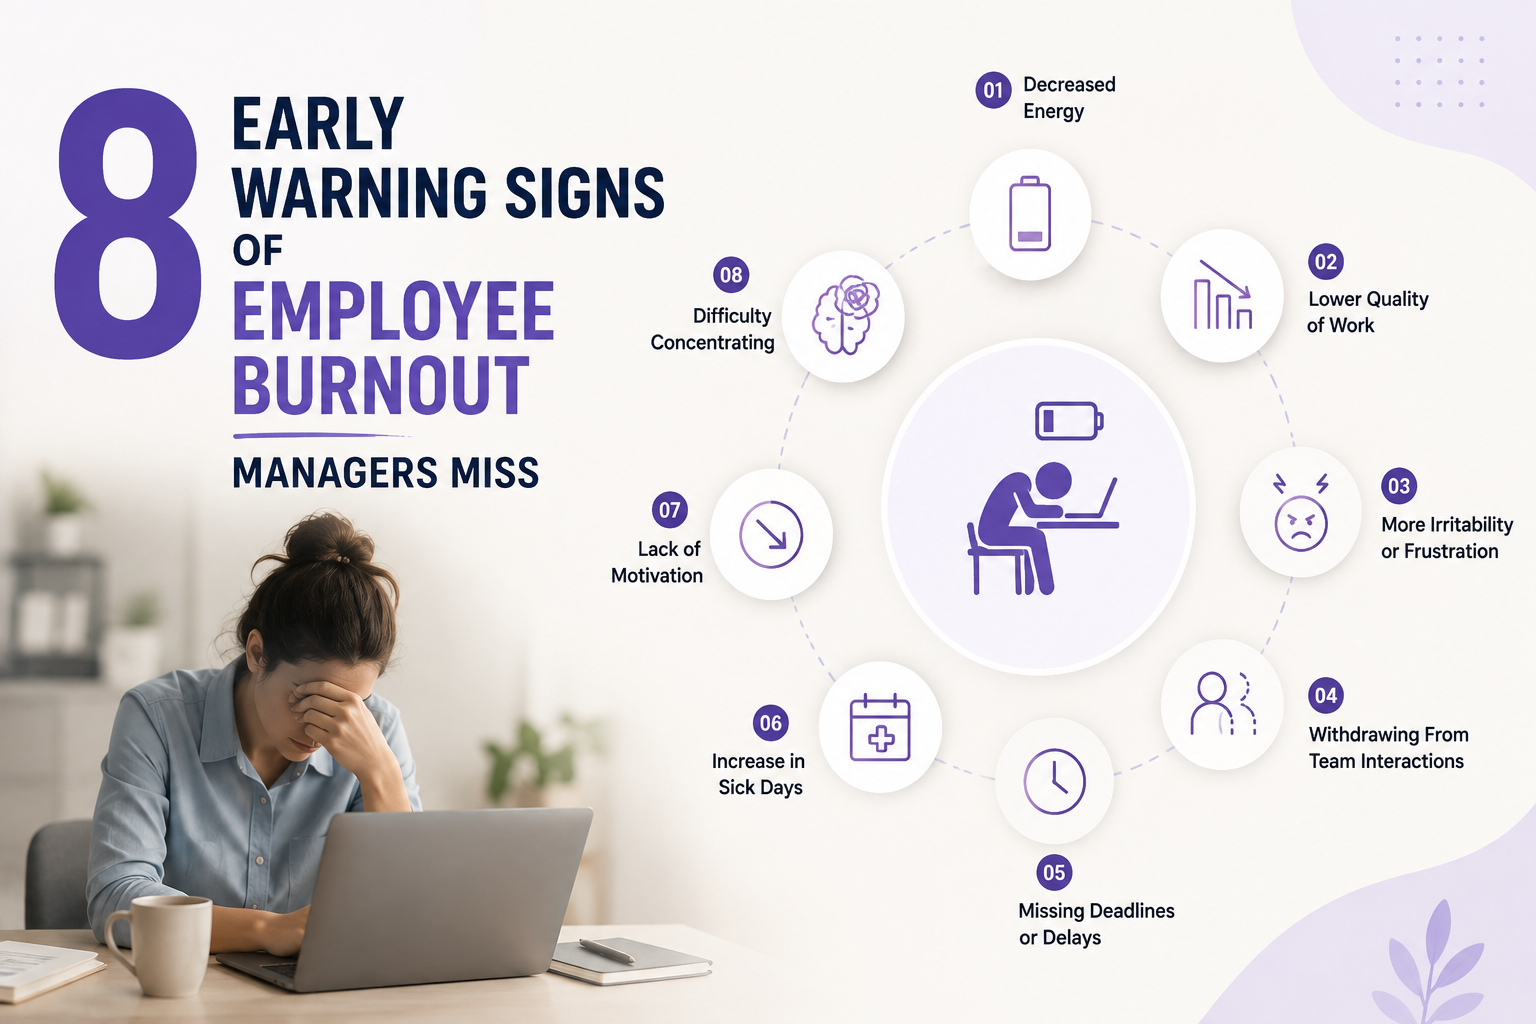
Absenteeism tracks days lost as a percentage of contracted working days. It’s frequently treated as an HR metric rather than an operational one, but it’s one of the earliest available warning signs of both burnout and impending attrition — increased unplanned absences reliably precede voluntary resignation in workforce data.
How to act on it: Watch absenteeism trends per agent, not just the site-wide average. An agent whose absenteeism has doubled over two months is a far more useful signal than a stable center-wide rate that’s quietly masking a handful of at-risk individuals.
6. Agent Turnover Rate
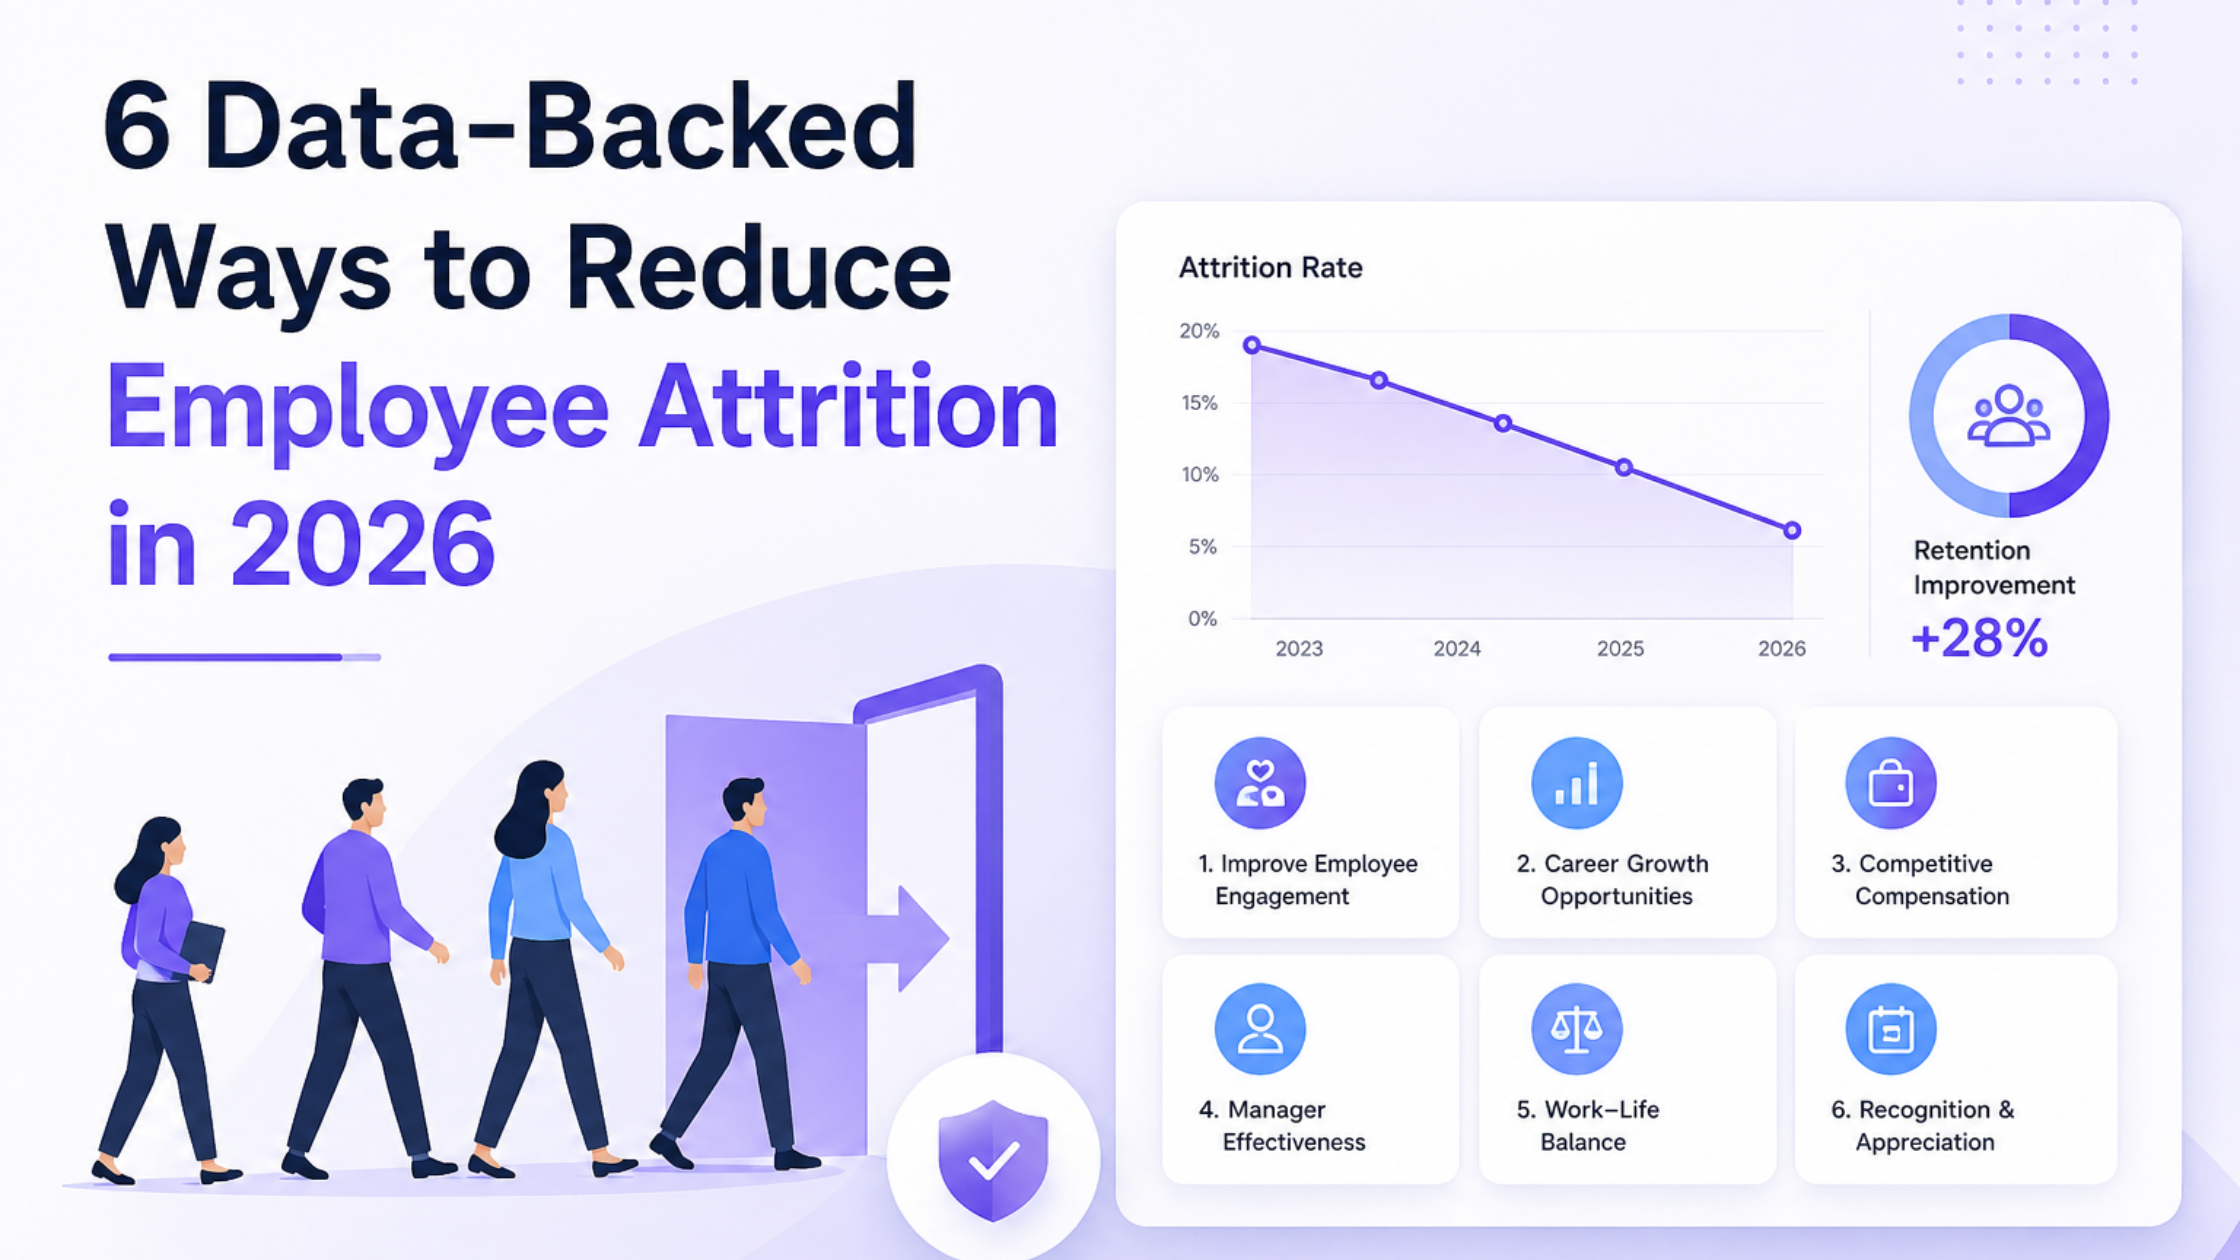
This is the metric everything else eventually rolls up into. At an industry-typical 30% annual turnover, a 100-seat call center is replacing roughly 30 agents a year — each of whom takes weeks to ramp to full productivity and requires renewed QA calibration in the interim, which is a hidden cost beyond the direct hiring spend. Roughly a third of employees who leave any job cite a lack of career growth opportunity as the reason, and contact centers, with often limited advancement paths, are especially exposed to this driver.
How to act on it: Segment turnover by tenure band (0–3 months, 3–12 months, 12+ months). If most attrition is happening in the first 90 days, the fix is in onboarding and early support — not compensation or scheduling.
7. Customer Satisfaction (CSAT) Correlated to Agent-Level Data
CSAT surveys measure the customer’s own rating of the interaction, and they’re the metric leadership ultimately cares about most. But CSAT in isolation tells you what happened, not why. The real value comes from correlating CSAT scores against agent-level data — handle time, resolution status, occupancy at the time of the call, even time-of-day — to find the operational conditions that produce both great and poor experiences.
How to act on it: Build a simple cross-tab: CSAT against AHT, against FCR, against agent tenure. Patterns that emerge (e.g., CSAT drops sharply on calls resolved in under 90 seconds) tell you where quality is being sacrificed for speed, and let you fix the incentive rather than just the outcome.
Why These Seven, and Not More
It’s tempting to track everything a dialer or CRM can report. In practice, service level, AHT, FCR, occupancy, absenteeism, turnover, and CSAT cover the three things that actually run a call center: whether you’re staffed correctly right now, whether agents are resolving issues efficiently, and whether the people delivering that resolution are at risk of burning out or leaving. Almost every other metric is a derivative of these seven.
Connecting the Metrics to the People Behind Them
The hardest part of call center management isn’t collecting these numbers — most dialers and CRMs report them natively. It’s connecting them to individual agents early enough to intervene, especially across large or distributed teams where a manager might be responsible for 20+ agents across multiple shifts.
This is where workforce analytics platforms add a layer the raw KPI dashboard can’t. We360.ai, for example, tracks agent-level activity, attendance, and productivity trends continuously, and surfaces deviations from an individual agent’s own baseline — catching the early absenteeism creep, the occupancy spike that precedes burnout, or the tenure-band cluster driving your turnover number, before it shows up as a resignation. For BPOs and call centers operating on thin margins per seat, the difference between reading these seven KPIs as historical reports versus real-time signals is often the difference between managing attrition and being surprised by it.
Track these seven consistently, segment them by the dimensions that matter — time, tenure, issue type — and pair them with real-time agent-level visibility, and you’ll catch the operational and people problems that a monthly scorecard alone will always report too late to fix.
Key Takeaways
- Service level, AHT, and FCR together capture whether a shift is staffed correctly and resolving issues efficiently — track them together, never AHT alone.
- Occupancy has a ceiling: pushing it too high trades short-term efficiency for long-term burnout and attrition risk.
- Absenteeism and turnover are your earliest and most expensive people-signals — segment both by tenure band, since most attrition concentrates in the first 90 days.
- CSAT means the most when cross-tabbed against agent-level operational data, not viewed as a standalone score.
- With industry turnover averaging 30% annually and replacement costs rising, agent-level visibility — not just site-wide averages — is what turns these seven KPIs into an early-warning system rather than a monthly report card.
Frequently Asked Questions
What is the single most important call center KPI? There isn’t one universal answer, but first call resolution is the metric most consistently cited as the strongest driver of customer satisfaction, and agent turnover rate is the metric most predictive of long-term operational cost. If forced to pick just two to start with, those are the pair worth building a habit around before adding the rest.
How often should call center KPIs be reviewed? Service level and occupancy should be monitored in near real time, since they reflect staffing adequacy for the current shift. AHT, FCR, and CSAT are best reviewed weekly to catch trends without overreacting to single-day noise. Absenteeism and turnover are best tracked monthly, segmented by tenure band, since these are slower-moving but higher-cost signals.
What’s a healthy call center turnover rate? Industry data puts average annual contact center turnover around 30%, so anything meaningfully above that — especially concentrated in the first 90 days of employment — signals an onboarding or early-support gap rather than a broad culture problem. Rates well below industry average are achievable but typically require deliberate investment in career pathing and manager quality, not just compensation.
Can call center KPIs actually predict which agents are about to quit? Yes, with reasonable lead time. Rising absenteeism, declining occupancy without a corresponding drop in call volume, and a widening gap between AHT and resolution quality are all documented precursors to voluntary resignation. Tracking these at the individual agent level, rather than only as site-wide averages, is what turns a lagging KPI dashboard into an early-warning system.
Sources: Talkdesk, “12 Call Center KPIs to Track for Success”; Gitnux Call Center Attrition Statistics 2026; Gitnux Call Center Turnover Statistics 2026.