
Top Productivity Metrics Every HR Leader Should Track
In today’s data-driven workplace, intuition alone is no longer enough to improve performance. HR leaders are increasingly relying on productivity metrics to gain clear visibility into workforce performance, employee efficiency, and organizational health.
With the rise of workforce analytics software, tracking the right employee productivity KPIs has become crucial for making informed decisions about hiring, retention, and engagement. From identifying hiring bottlenecks to measuring employee commitment and output, accurate productivity reports enable HR teams to transition from reactive problem-solving to proactive workforce planning.
In this blog, we’ll explore the top productivity metrics every HR leader should track to optimize talent strategies, strengthen engagement, and drive sustainable business growth.
Top employee productivity metrics HR leaders must track
In a rapidly evolving workplace, understanding what truly drives performance is critical for HR success. Tracking the right employee productivity metrics enables HR leaders to measure workforce performance, identify inefficiencies, and make data-backed decisions that improve business outcomes.
Here are the top 12 productivity metrics to track to improve employee performance:
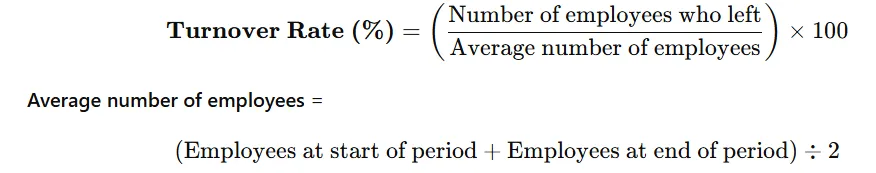
- Employee turnover rate : It is the percentage of employees who leave during a specific time period. This could be due to resignation, retirement, termination or other reasons. It helps employers evaluate stability of the workforce and effectiveness of retention strategies.
- Time to fill : Time to fill is a hiring metric that shows how long it takes to fill a job role from the moment the job is officially approved/opened until a candidate accepts the offer. A shorter time to fill isn’t always better. Hiring too fast can lead to poor-quality hires, while hiring too slowly can cost the business revenue and team morale.

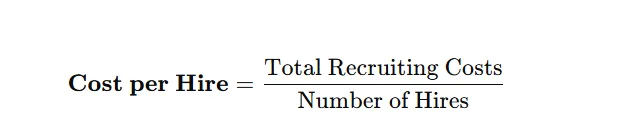
- Cost per hire : Cost per hire is a recruitment metric that shows how much money a company spends to hire one employee. It helps organizations understand the financial efficiency of their hiring process. Cost per hire is necessary because it helps manage hiring budgets, measures recruitment efficiency, compares different hiring channels and supports better workforce planning.
- Quality of hire : Quality of hire measures how successful and valuable a new employee is after being hired. It helps organizations evaluate whether their hiring process is bringing in the right talent, not just filling roles quickly or cheaply.

- Performance score = Performance appraisal rating after 3, 6 or 12 months
- Retention score = Whether an employee stayed for a definite period (1 = stayed, 0 = left)
- Hiring manager satisfaction = Manager’s rating of the hire’s fit, productivity, and skills
- Source of hire : Source of hire is a recruitment metric that identifies where successful candidates come from. It helps organizations understand which hiring channels deliver the best candidates, not just the most applications.
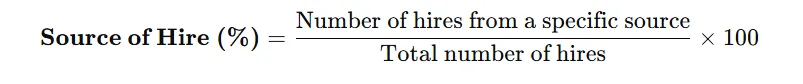
- For e.g.
total hires = 20 and hires from LinkedIn = 8 - Source of hire ( LinkedIn) = (8/20) x 100 = 40%
- Employee engagement score : Employee engagement score measures how emotionally committed, motivated, and involved employees are in their work and with the organization. It’s typically calculated using employee survey responses.
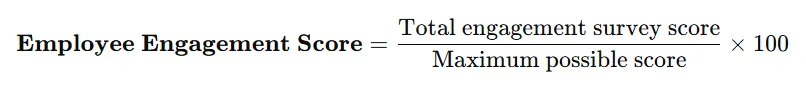
- E.g.:
10 questions x 5-point scale = 50 max score - Employee’s total score = 38
- Emgagement score = 38/50x100 = 76%
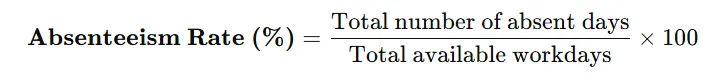
- Absenteeism rate : Absenteeism rate measures how often employees are absent from work during a specific period. It helps organizations understand attendance patterns and identify productivity or engagement issues.
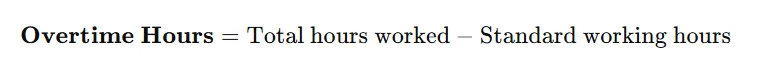
- Overtime hours : Overtime Hours represent the extra hours employees work beyond their regular scheduled working hours (for example, beyond 8 hours per day or 40 hours per week, depending on company policy or labor laws).
- Employee turnover rate : Employee Turnover Rate measures how many employees leave an organization during a specific time period. It helps HR teams understand retention issues, workforce stability, and overall employee satisfaction.


- Voluntary turnover rate : Voluntary Turnover Rate measures the percentage of employees who leave an organization by choice (resignations), excluding layoffs, terminations, or retirements initiated by the employer.

- Retention rate : Retention rate measures the percentage of employees who stay with the organization over a specific period. It’s a key indicator of employee satisfaction, engagement, and workplace stability.

- Employee Net Promoter Score (eNPS) : eNPS measures how likely employees are to recommend your company as a place to work. It’s a simple, widely used metric to gauge employee loyalty and overall engagement.
- Employes must answer a question like - “On a scale of 0–10, how likely are you to recommend this company as a place to work?”
- Promoters (9–10) = Highly engaged and loyal
- Passives (7–8) = Neutral
- Detractors (0–6)
Track productivity metrics with we360.ai
With we360.ai, HR leaders can easily track key employee productivity metrics and measure workforce performance in real time. From employee turnover rate, time to fill, cost per hire, quality of hire, engagement scores, to overtime hours, all metrics are available in one unified dashboard.
Generate actionable productivity reports, monitor trends, and make data-driven HR decisions faster. We360.ai turns workforce data into insights that help improve retention, optimize hiring, and boost overall employee productivity.
To track your organization’s productivity metrics, book a FREE DEMO with we360.ai today!