ROI & Productivity Trends

Experience clear visibility into workforce ROI and productivity patterns across teams, time periods, and tools. Uncover which departments generate real business value—and where hidden inefficiencies lie.
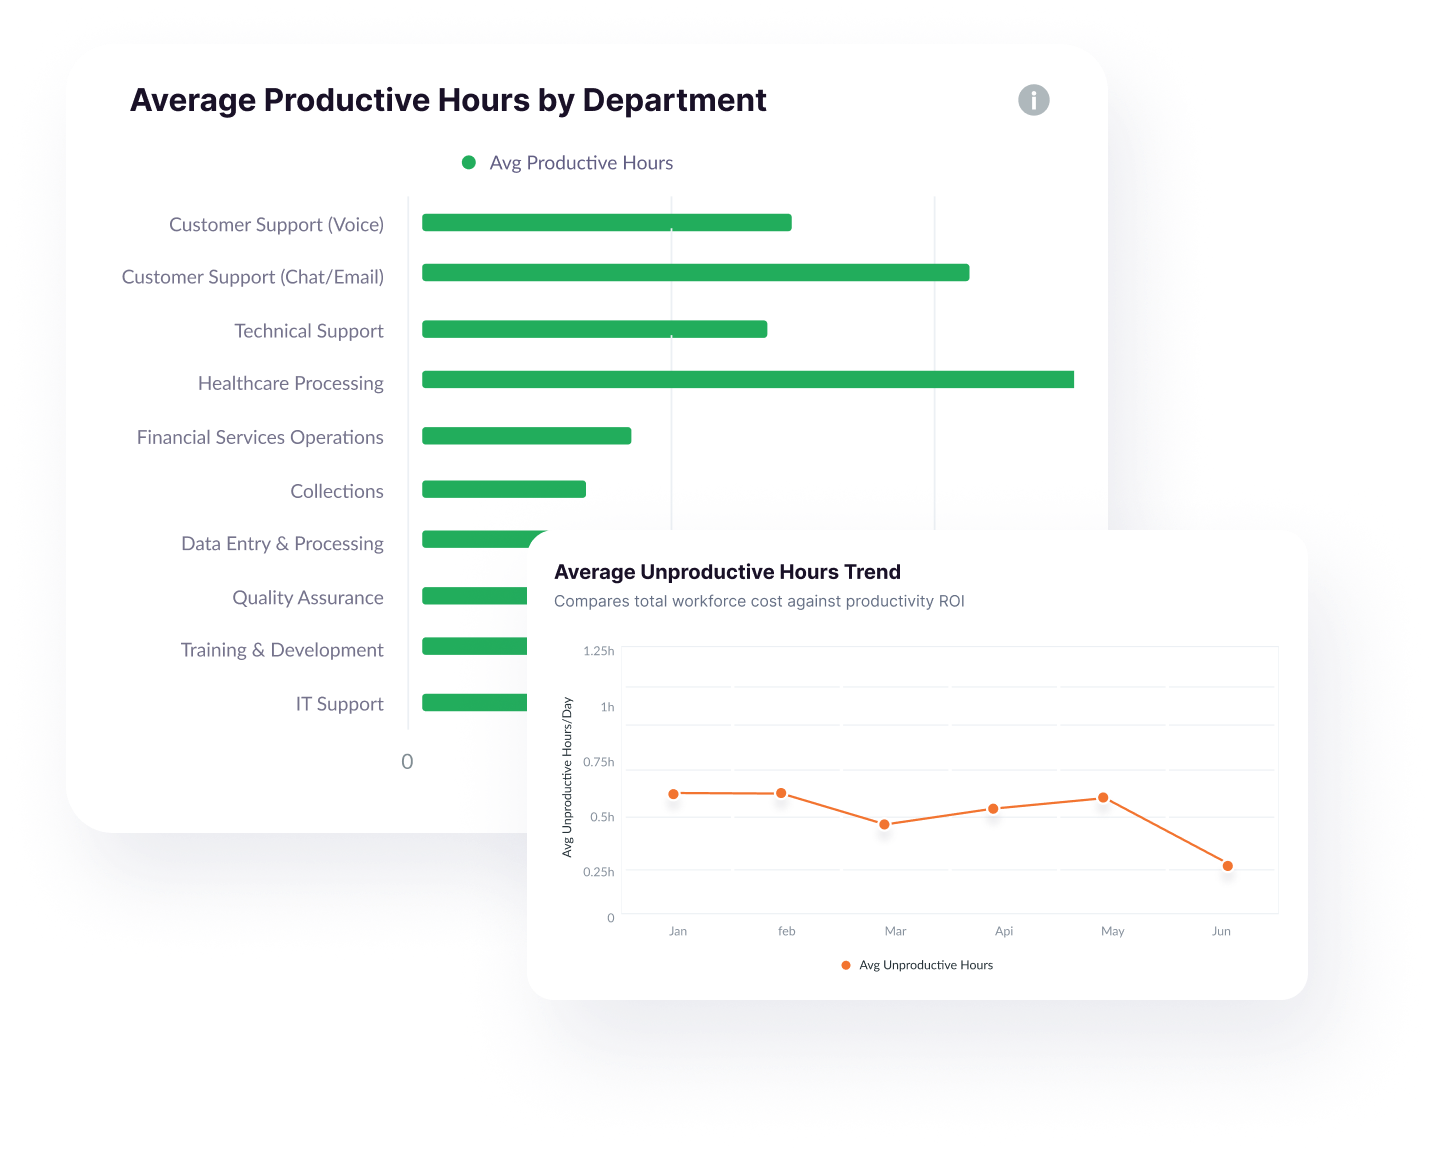
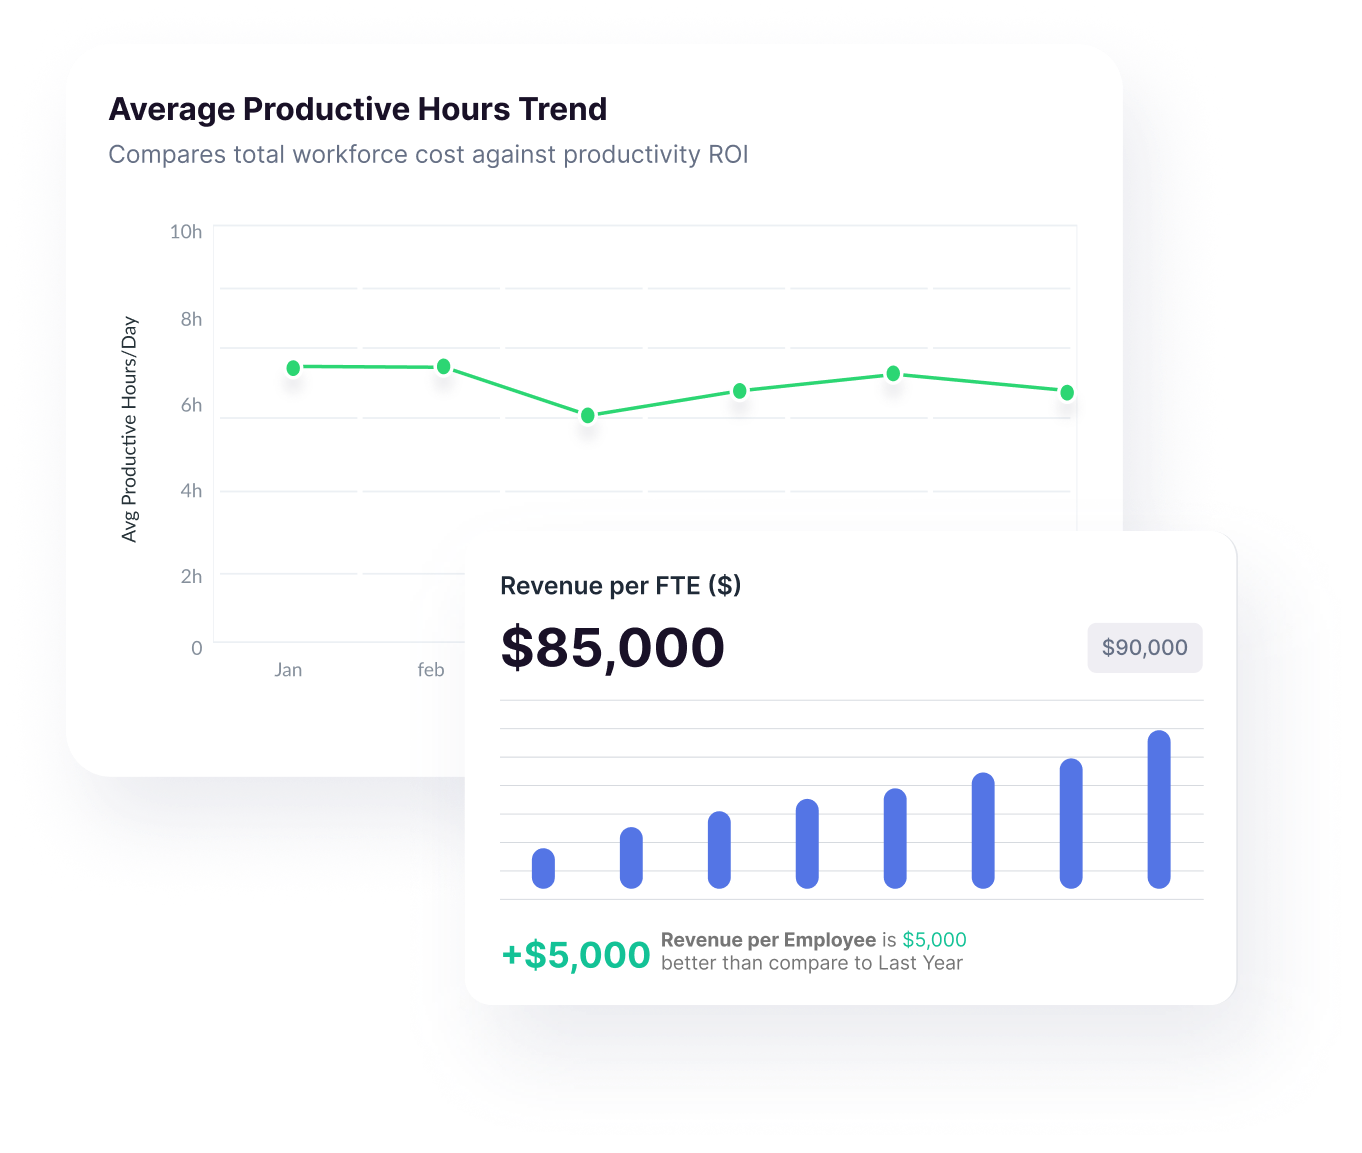
Compare productive vs unproductive hours against workforce costs and ROI.
Dive deep into how every hour is spent—and what value it brings. This view compares productive and unproductive hours side by side with workforce cost and ROI, letting you clearly see which departments are contributing to your bottom line and which need attention.
Quickly identify high-performing departments, time-draining tasks, and gaps where training or smarter workflows can make an immediate impact. Perfect for aligning team effort with strategic business outcomes.
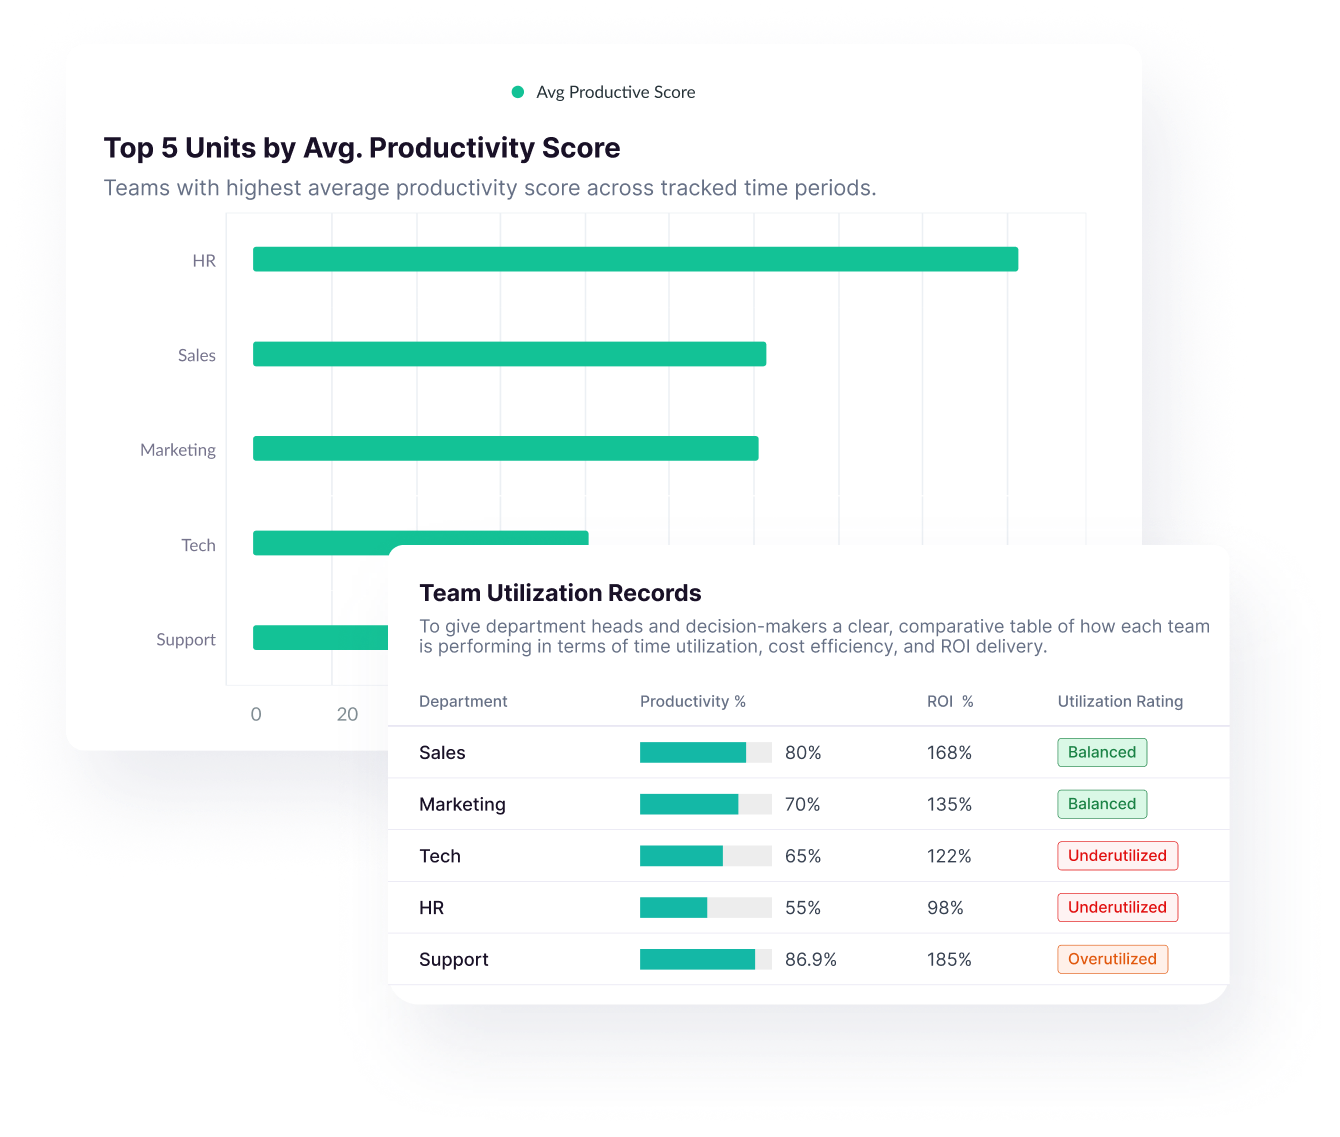
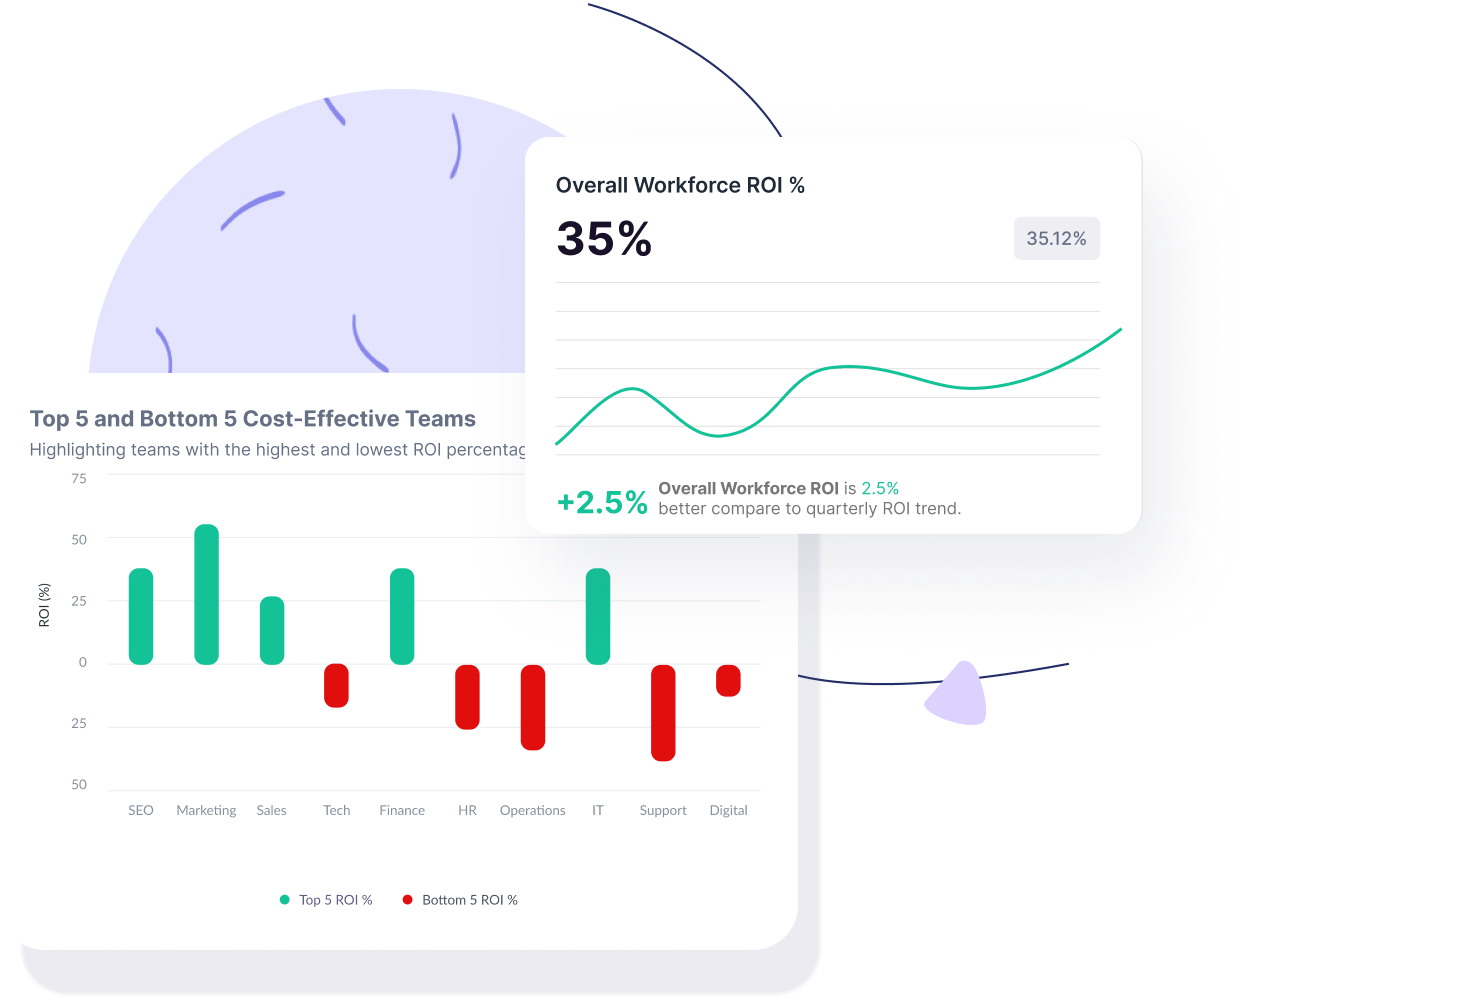
Understand workload distribution, tool usage, and ROI to optimize team effectiveness.
Get a multi-dimensional view of team performance. This section visualizes how busy each team is, which tools they use, and whether their output justifies the effort. By comparing workload to ROI, you can pinpoint overworked teams that are driving value—or underperformers who need support. Match tool adoption with productivity scores to evaluate if your software investments are actually paying off. This insight helps you allocate resources wisely, spot burnout risks, and invest where returns are strongest.
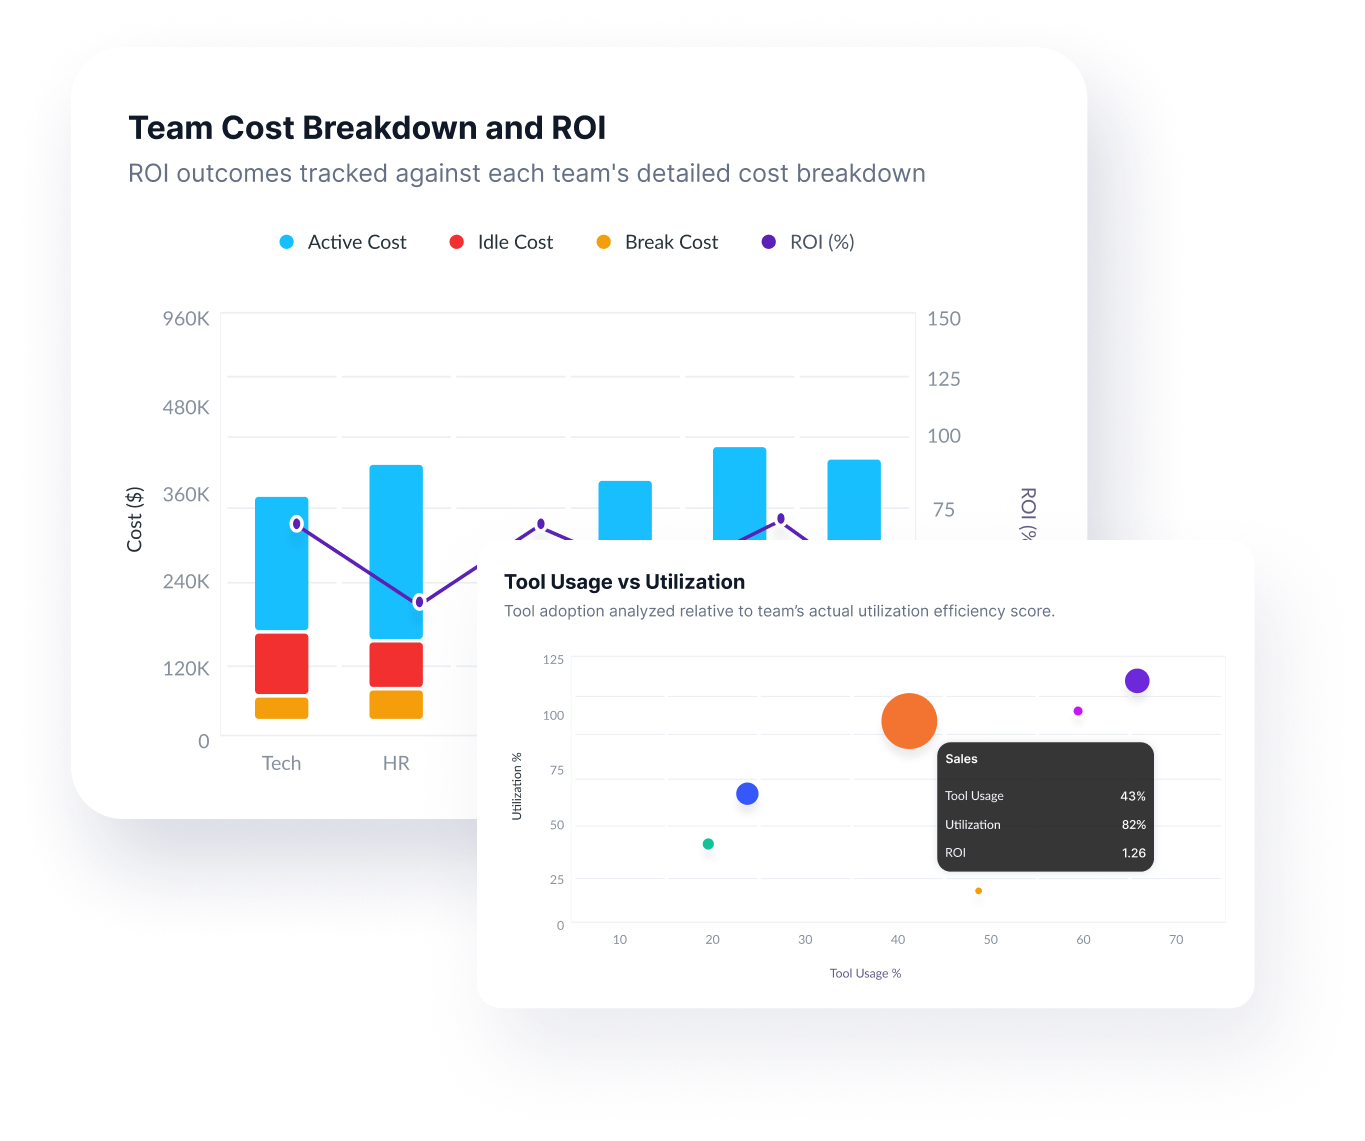
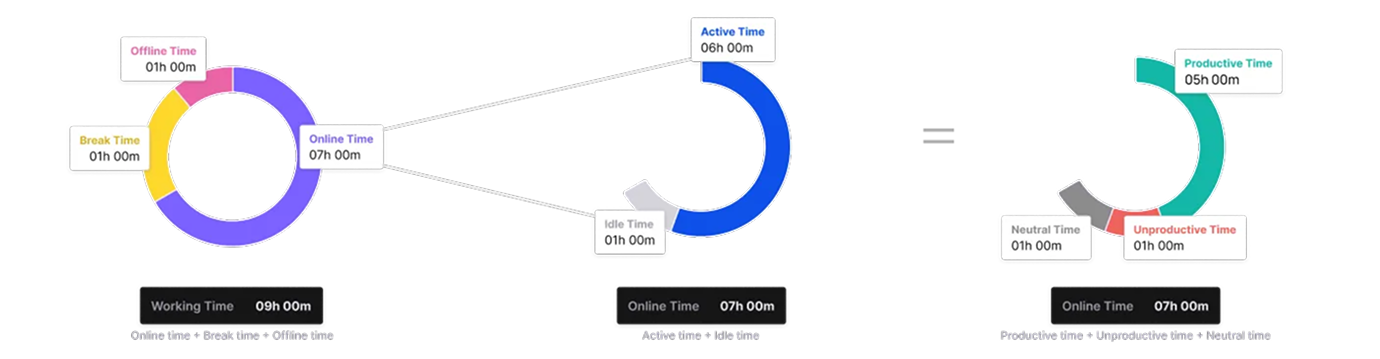
Link time, tools, and team efforts to business outcomes.
Understand how time spent and tools used translate into financial returns. This tab breaks down cost-to-output ratios, active time vs results, and ROI patterns by department, tool, and role.
It helps leadership teams uncover inefficiencies, scale high-performing behaviors, and align work with strategic goals. Use these insights to eliminate guesswork and make confident, impact-driven decisions.
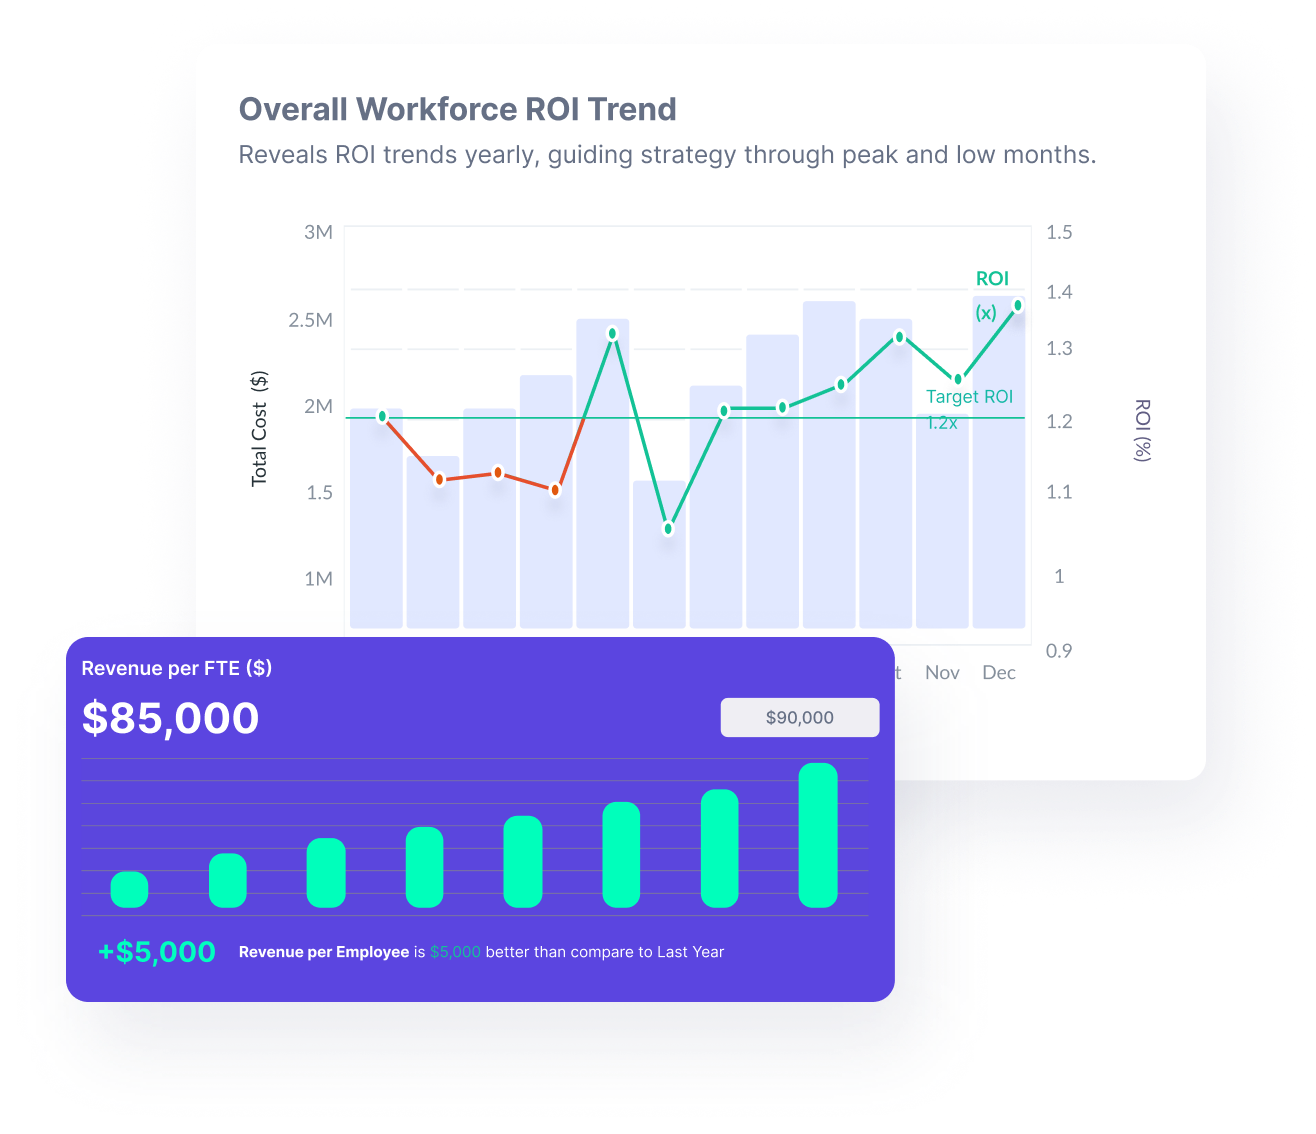
Monitor evolving productivity and ROI patterns over time.
See how team performance shifts month over month. This view shows fluctuations in ROI, productivity hours, and tool effectiveness—enabling you to detect dips early and act fast.
Whether you’re managing distributed teams or reviewing yearly trends, this module gives you the foresight to adjust hiring, budget allocation, and process changes with precision.
How it works

No matter what kind of home you have to share, you can increase your earnings.

No matter what kind of home you have to share, you can increase your earnings.

No matter what kind of home you have to share, you can increase your earnings.
Perfect for business leaders, HR heads, operations managers, finance teams, and department heads who need a clear view of where productivity turns into profit—and where time is being lost.

Security & Compliance
Ensures privacy and security with encrypted data, secure connections, and multi-standard compliance

Demonstrating our commitment to security, availability, processing integrity, confidentiality, and privacy.

Ensuring compliance with European Union data protection and privacy regulations.

Certified adherence to international standards for information security management.

Demonstrating our commitment to health data privacy, security, and HIPAA compliance.
They’re based on time tracking, tool usage, and cost data—processed with automated analytics for dependable trends.
Yes. Productive time directly correlates to business value—this feature quantifies that.
Are team rankings fair and unbiased?
Yes. Rankings are based on measurable metrics like productivity, time spent, and ROI, not subjective evaluations.
Definitely. You’ll gain confidence to back your staffing, budgeting, and process changes with real data.
Let’s discuss how we can tailor We360.ai for your enterprise.
Ready for 7 days trial | Exclusive support | No fees


