


![People Analytics [2026]: Definition, Tools, Use Cases](https://media.we360.ai/media/People Analytics 2026-Definition, Tools, Use Cases.png?v=2026-08-13T07%3A38%3A36.736Z)


Summarize With AI


Key Take Aways
- People analytics turns workforce data into better business decisions across hiring, retention, productivity, engagement, and workforce planning.
- The seven pillars are capability, capacity, capacity utilisation, collaboration, connection, conformance, and culture.
- Start small and focus on business questions instead of creating too many dashboards or measuring data that doesn't drive decisions.
- Privacy, transparency, and ethics matter because employee data must be collected and used responsibly.
- AI is changing people analytics through predictive insights, continuous employee listening, workforce planning, and automated recommendations.
- Successful adoption requires more than technology—HR, finance, operations, managers, and employees all need to be involved.
People analytics is no longer a “nice to have” because it has become the operating system of the modern HR function. Boards now ask CHROs for the same rigour that their CFOs deliver, which means numbers, trends, forecasts, and a clear line from workforce decisions to revenue. This guide explains what people analytics is in 2026, the seven pillars that frame it, the tools that power it, the salaries it commands, and how operations and HR leaders in India and APAC can roll it out without a six-figure consulting bill.
We360.ai works with over 10,000 companies across more than 21 countries, and the patterns below come from that operating data along with authoritative sources, including McKinsey’s people analytics practice, SAP’s workforce research, and the CIPD analytics factsheet.
Why this matters for modern distributed teams
Hybrid and remote work shattered the manager’s line of sight. A team lead in Bengaluru cannot watch a developer in Pune the way they could in 2019. People analytics replaces that lost visibility with signals such as activity patterns, collaboration graphs, project velocity, and engagement pulses, so leaders can coach instead of guess. For distributed teams, it is the difference between trust built on data and surveillance built on suspicion.
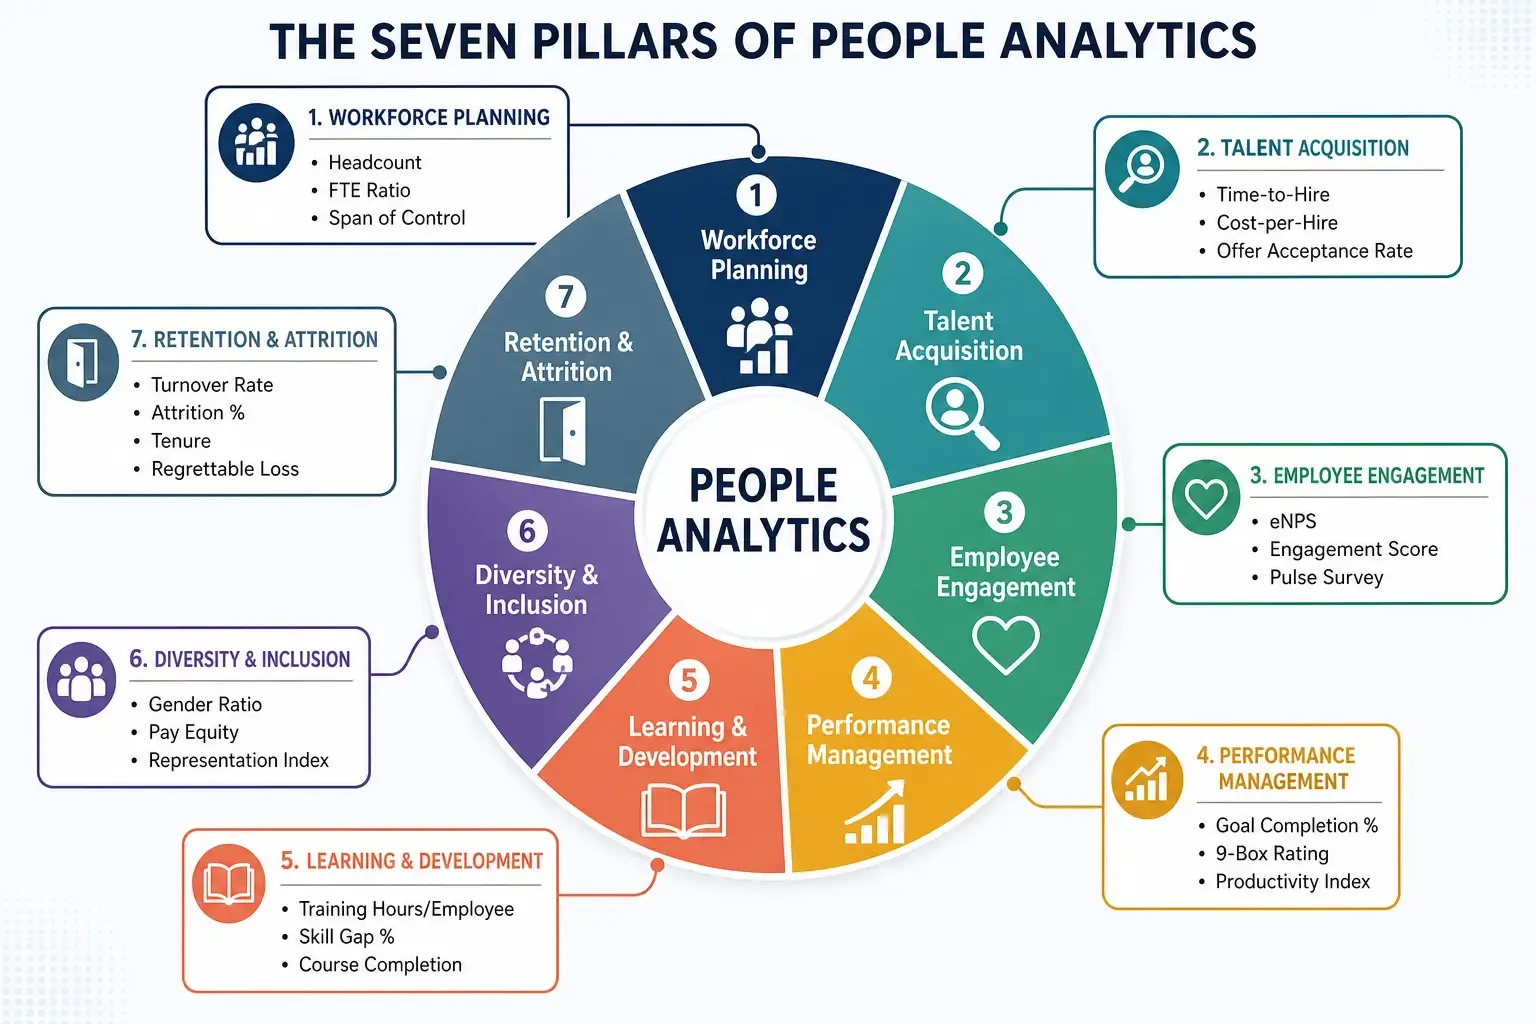
The 7 Pillars of People Analytics
The seven pillars framework, popularised by SAP SuccessFactors and reinforced in the Wharton People Analytics specialisation, gives HR teams a clean taxonomy for every workforce question.
# | Pillar | What it measures | Example KPI |
|---|---|---|---|
1 | Capability | Skills, competencies, certifications | Skill coverage % per role |
2 | Capacity | Headcount, FTE, span of control | FTE vs demand forecast |
3 | Capacity Utilisation | How time is actually spent | Productive hours over available hours |
4 | Collaboration | Cross-team communication patterns | Meeting load, network density |
5 | Connection | Belonging, manager rapport | eNPS, 1:1 frequency |
6 | Conformance | Policy, compliance, attendance | Shift adherence percentage, policy breach rate |
7 | Culture | Values, sentiment, inclusion | Pulse survey scores, DEI index |
Each pillar maps to a different stakeholder. Capacity utilisation matters to COOs. Connection and culture matter to CHROs, while conformance matters to risk and audit teams. A mature people analytics function reports on all seven rather than just the two or three that are easy to measure.
Pros, Cons & Common Misconceptions
People analytics delivers four documented gains. The first is faster hiring, and Google famously cut interview rounds from 12 to 4 by using analytics. The second is lower attrition, where Nielsen saved 100 million dollars over six years. The third is better internal mobility, and the fourth is defensible DEI progress. On the r/analytics thread debating this discipline, practitioners consistently flag the same upside, which is that decisions become arguable instead of political.
The cons are real. Data quality in HRIS systems is notoriously poor. Managers fear being measured. Employees fear being surveilled. Vendors also overpromise AI that underdelivers.
Common misconceptions
The biggest myth is that people analytics equals employee monitoring, but it does not. Monitoring is one input among many, and analytics is the interpretation layer that converts signals into decisions. The second myth is that you need a data scientist on day one. You do not, because most SMBs start with a dashboard, a clean attendance feed, and one business question.
The third myth is that people analytics is HR’s job alone. In practice the best programmes are jointly owned by HR, finance, and operations because the questions cut across all three functions.
Real World Day in the Life of a People Analytics Professional
Priya is a Senior People Analytics Manager at a 2,400-person IT services firm in Hyderabad. Her Tuesday looks like this.
At 9:30 AM she opens the attrition dashboard and notices that voluntary exits in the QA function spiked 18% last month. By 10:15 she has pulled tenure, manager, and engagement data into a cohort view and isolated the spike to three teams under one director. At 11:00 she meets the HRBP to design a stay interview protocol for the affected teams.
After lunch she works with Finance on the headcount plan for FY27 and models three demand scenarios against the capability gaps that her skills inventory flagged last quarter. At 4:00 PM she presents a bias audit of the latest promotion cycle to the DEI council. At 5:30 she ships a Looker dashboard refresh to seventy line managers.
There is no model training and no PhD-level statistics. Most days, people analytics is 70% asking the right business question, 20% cleaning data, and 10% telling the story. The AIHR people analytics guide confirms that this ratio holds across companies of every size.
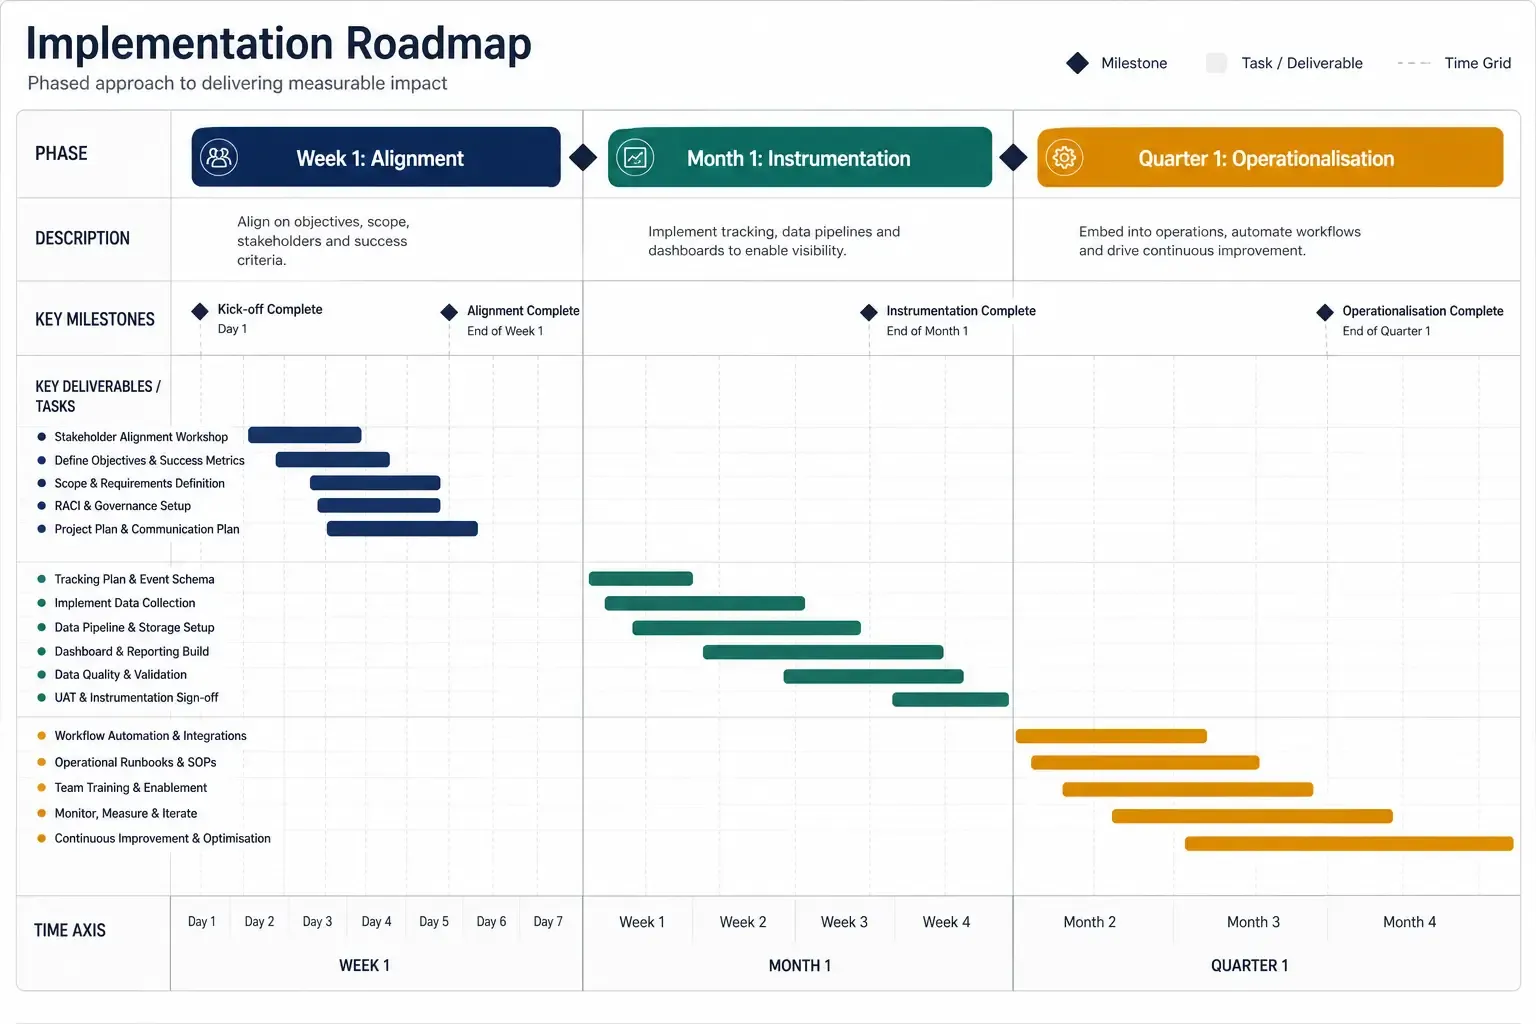
Implementation Roadmap (for any organization size)
A practical rollout fits into one quarter for SMBs and two quarters for enterprises. The phases below assume you already have a payroll or HRIS system in place.
Implementation roadmap (week 1, month 1, quarter 1)
Week 1: Align. Pick three business questions worth answering, such as “Why are first-year exits rising?" Identify data owners. Get legal sign-off on the data you intend to use. Choose a primary tool from the options in Section 6.
Month 1: Instrument. Connect HRIS, attendance, and one productivity source such as Slack, Jira, or a workforce analytics platform. Build the first three dashboards, which are attrition cohort, capacity utilisation, and engagement pulse. Train five line managers as pilot users.
Quarter 1: Operationalise. Roll out to all people managers. Establish a monthly people analytics review with the CHRO and COO. Tie one decision per month explicitly to the dashboard. Publish a quarterly state of the workforce report to the executive committee.
The companies that succeed treat this as a product launch rather than an IT project. They appoint a product owner, ship weekly, and kill metrics that nobody uses.
Common pitfalls to avoid
Three patterns destroy people's analytics programmes. The first is dashboard sprawl, where fifty reports sit unopened. The second is measuring what is easy, such as login counts, instead of what matters, such as output quality. The third is launching without manager training, because a dashboard handed to an untrained manager becomes a weapon rather than a tool.
Tools & Platform Comparison
The 2026 market splits into four clear segments. The first is workforce analytics suites such as We360.ai and ActivTrak. The second is enterprise people analytics platforms like Visier, Crunchr, and One Model. The third is HRIS-embedded analytics, including Workday, SAP SuccessFactors, and Darwinbox. The fourth are engagement specialists such as Culture Amp, Lattice, and Peakon.
Platform | Best for | Starting price | Strength |
|---|---|---|---|
SMB to mid-market, India and APAC | ₹299 per user per month | Productivity, attendance, and workforce analytics in one | |
Visier | Large enterprise | Enterprise pricing | Predictive workforce planning |
Workday | Global enterprises | Enterprise quote | Embedded in HRIS |
Culture Amp | Engagement-led teams | Per user | Survey science, manager nudges |
Darwinbox | India-headquartered firms | Custom | Local compliance, payroll-linked |
Key features to look for
Buy for these five capabilities. The first is a unified data model. The second is manager grade self-service dashboards. The third is role-based access controls aligned to DPDP and GDPR. The fourth is an open API for HRIS and finance integration. The fifth is a transparent productivity model that employees can see and challenge. Anything else is a feature rather than a foundation.
For Indian operations leaders specifically, our workforce analytics India guide walks through compliance, language, and shift pattern considerations that global platforms often miss.
Pricing models (per user, per seat, enterprise)
Three pricing shapes dominate. Per-user-per-month pricing from vendors like We360.ai and Lattice is predictable and scales with headcount. Per-seat licensing from Visier charges for analyst seats and is cheaper at large scale. Enterprise contracts from Workday and SAP bundle people analytics into a wider HCM deal and rarely beat point solutions on price per insight. For most SMBs and mid-market firms, per user per month delivers the fastest payback.
ROI Calculator & KPI Dashboard
The simplest people analytics ROI formula has three inputs. These are the cost of attrition avoided, the cost of productive hours recovered, and the cost of better hires being retained. A 500-person company with 18% attrition that drops to 14% annually at an average loaded cost of ₹6 lakh per replacement.
Measuring ROI and proving impact
Tie every dashboard to one decision and one rupee figure. If a manager 1:1 frequency metric does not change a behaviour that changes a cost, retire it. The CFO does not care about dashboards because the CFO cares about cost per hire, revenue per FTE, and regretted attrition. Report on those three, and the budget conversation gets easier every year.
Download our free ROI calculator template and KPI dashboard starter pack, which includes the formulas above pre-built for Indian salary bands.
Want to see how this works for your team? Book a Demo → /demo
Career Path & Salary Guide
People analytics is one of the fastest-growing HR specialisations in India. LinkedIn’s Emerging Jobs report has flagged it in the top 15 for three consecutive years, and demand outstrips supply roughly three to one in metro markets.
Salary ranges in India (2026)
- People Analytics Analyst (0 to 3 years): ₹8 to ₹14 LPA
- Senior Analyst or Consultant (3 to 6 years): ₹14 to ₹24 LPA
- People Analytics Manager (6 to 10 years): ₹24 to ₹38 LPA
- Head of People Analytics (10+ years): ₹38 to ₹65 LPA, plus equity at listed firms
People analytics courses and certifications
The most respected credentials in 2026 are the Wharton People Analytics specialisation on Coursera, the AIHR People Analytics Certificate, the MIT Sloan executive programme, and the Josh Bersin Academy HR Analyst credential. None of these require a quantitative undergraduate degree, because strong Excel, SQL, and storytelling skills get you further than a statistics PhD.
What hiring managers actually screen for
In rank order, hiring managers screen for a portfolio of real analyses; fluency in SQL and one BI tool such as Power BI, Looker, or Tableau; basic statistics including regression and A/B testing; business acumen; and stakeholder communication. The portfolio matters more than the certificate.
Ethical, Privacy & Bias Considerations
The legal floor has risen. India’s Digital Personal Data Protection Act 2023 (DPDP) requires explicit consent, purpose limitation, and data minimisation for employee data. The EU AI Act classifies workforce analytics as high risk in several use cases. Singapore’s PDPA and Australia’s Privacy Act amendments add similar weight across APAC.
Compliance and ethics considerations
Three rules keep programmes safe. Collect the minimum data needed for the stated purpose. Make the model explainable, because if a manager cannot describe how a score is calculated, you should not deploy it. Audit for disparate impact across gender, age, region, and tenure every quarter. The CIPD analytics factsheet and Culture Amp’s people analytics guide both stress that transparency with employees is the single biggest predictor of programme survival.
Bias enters through training data, feature selection, and threshold choices. The fix is not to “remove gender from the model”, because that hides bias rather than solving it. The fix is to measure outcome parity, publish the gaps, and close them.
Change Management & Stakeholder Buy-In
Technology is the easy part. Adoption is where 60% of people's analytics programmes stall, according to McKinsey’s organisational research. The pattern that works has four steps.
First, win the CFO with a costed business case before HR signs anything. Second, co-design dashboards with line managers rather than for them, because five workshops beat fifty emails. Third, communicate to employees what is measured, why it is measured, and what is not measured, because radical transparency reduces resistance more than legal disclaimers ever will. Fourth, publish wins quarterly, because a one page case study beats a ninety slide deck.
CHROs who treat people analytics as a culture programme rather than a software rollout see adoption rates above 80% within two quarters.
People Analytics for Small & Mid-Size Businesses
SMBs in India face a different problem than enterprises. They have less data, fewer analysts, and tighter budgets, yet they also move faster, and a single insight can shift a 200 person company in a way that it cannot shift a 20,000 person one.
Industry-specific considerations (BPO, IT services, banking)
BPOs live and die by shift adherence, average handle time, and 90 day attrition, so they need real-time conformance and capacity dashboards more than they need annual engagement surveys. IT services firms need bench utilisation, skills inventories, and projects. profitability per FTE. Banks need compliance trails, fraud pattern detection in operations teams, and tightly governed access controls. One platform rarely fits all three, so choose for your dominant use case.
We360.ai is built for these patterns. It starts at ₹299 per user per month, deploys in a day, and combines attendance, productivity, and engagement signals in one place. Our business intelligence module makes the analytics layer accessible to managers without a BI specialist on staff.
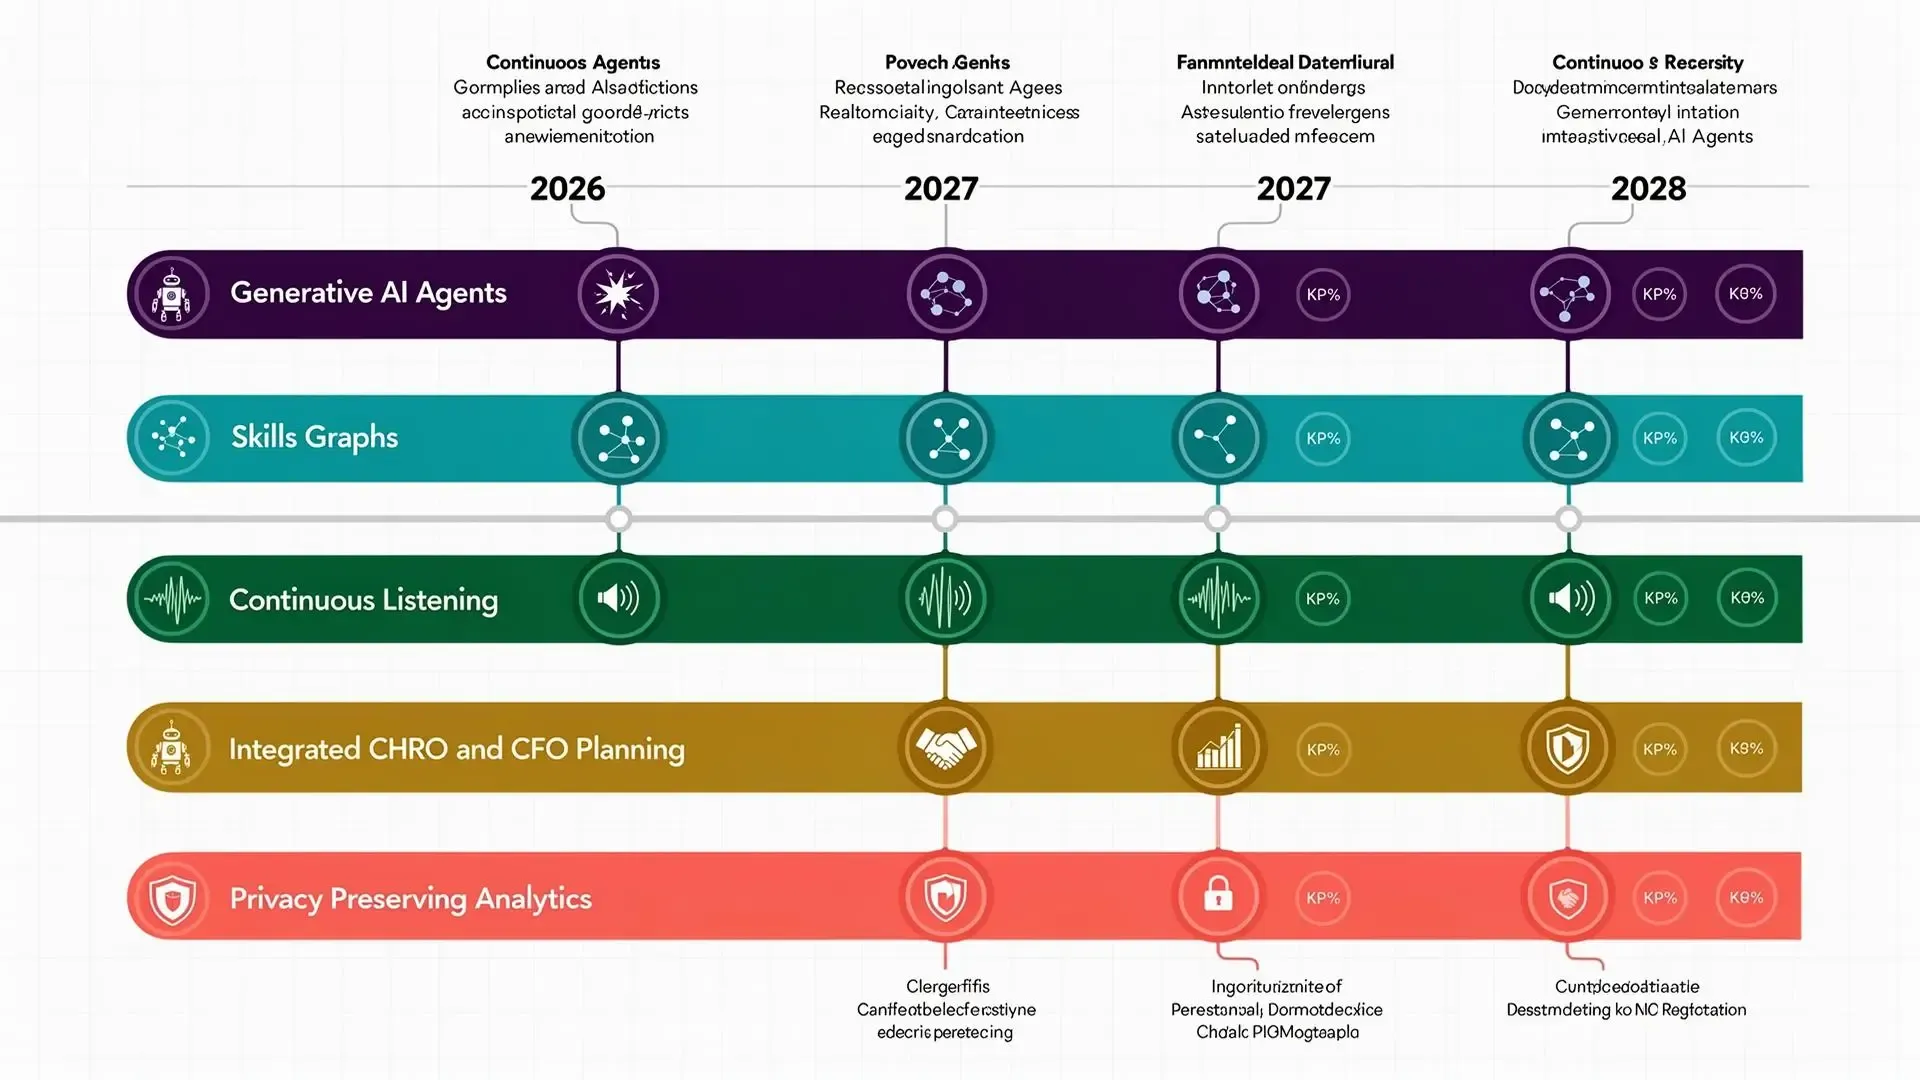
Future Trends (2026+)
Five shifts are reshaping the discipline this year.
Generative AI is moving from “ask the dashboard a question in English” to autonomous agents that draft retention plans, flag manager risks, and pre-fill HRBP case notes. Skills based organisations are replacing job title hierarchies, which means skills graphs are becoming the master data set for HR. Continuous listening is replacing annual engagement surveys, and pulse data now feeds models in near real time.
Workforce planning is converging with finance planning, so the new CHRO and CFO dashboard is one report rather than two. Privacy preserving analytics such as federated learning and differential privacy are also moving from research papers into production at companies that take DPDP and GDPR seriously.
Conclusion
People analytics in 2026 is no longer a specialist function for Fortune 500 HR teams, because it has become a baseline capability for any company that wants to compete for talent, control workforce cost, and keep boards confident. The seven pillars give you the map, and the tools, ethics, and change management practices in this guide give you the route.
Start small, instrument fast, and tie every metric to a rupee figure. The companies that win the next five years will be the ones that treat their workforce data with the same discipline that they treat their financial data, and that journey can start this week rather than next quarter.
Start Free Trial, No Credit Card or Book a Demo with We360.ai. Starts at ₹299 per user per month. 120K+ users, 10K+ companies, and 21+ countries trust We360.ai.
What is people analytics?
People analytics is the use of workforce data to understand employee behaviour and improve decisions around hiring, retention, productivity, engagement, and workforce planning.
What are the 7 pillars of people analytics?
The seven pillars are capability, capacity, capacity utilisation, collaboration, connection, conformance, and culture.
Why is people analytics important for businesses?
It helps organizations replace assumptions with data-driven insights, improve workforce planning, identify retention risks, measure productivity, and make better people decisions.
What tools are used for people analytics?
Common tools include workforce analytics platforms, HRIS-based analytics, enterprise people analytics platforms, and employee engagement tools. The right choice depends on the organization's size and use case.
Is people analytics the same as employee monitoring?
No. Employee monitoring can provide one source of workforce data, but people analytics combines and interprets multiple data sources to support broader workforce and business decisions
Related Posts
Bench time is common in staffing and services businesses, but it can quickly become costly if it isn’t managed well. This guide explains how to track bench time, keep employees engaged, identify upcoming opportunities, improve resource planning, and make better use of available talent while waiting for the next project.
Productivity Without Big Brother.webp?v=2026-08-22T07%3A23%3A14.411Z)
AI is becoming a bigger part of everyday work, from automating routine tasks to helping teams make faster decisions. This guide explores the key AI workplace trends shaping 2026, along with real-world examples of how businesses are using AI to improve productivity, collaboration, employee experience, and overall workplace efficiency.

Learn what an Employee 360 is, how it brings workforce data together, and how HR teams can use it to improve employee performance, engagement, and workforce decisions in 2026.
Uneven workloads can quickly lead to missed deadlines, stressed employees, and lower team productivity. This guide highlights common workload distribution mistakes and simple ways to fix them. Learn how to understand team capacity, assign tasks fairly, set realistic priorities, spot overloaded employees, and keep work moving without unnecessary pressure.